
As my teammate Ryan has discussed in previous articles, companies are collecting more data than ever, but aren’t able to use it quickly or effectively. At the core, data is intended to help you make decisions easier and faster. With so much data, it can become laborious to distill what is useful.
One of the simplest ways to use data for better decision making is to ensure you’re using the right metrics. Just like Marie Kondo asks you to decide whether things spark joy, I’m asking you to think about whether your metrics belong in your workflow. If they’re not helping you, get rid of them.
Metric selection can be a complicated process, so let’s break it down. Here are two ways to classify metrics that can simplify how you use them to make decisions.
Input metrics vs. output metrics
The first distinction to make when thinking about types of metrics is the difference between input metrics and output metrics. People who work with metrics are generally familiar with this concept, but being crisp about it will save lots of time down the road.
Output metrics
Output metrics are generally goals. They are indicative of the success of the business or the success of the team. Because of this, they are usually not directly influenced, which means that teams/people shouldn’t be managed relative to this metric. It is more beneficial to give teams metrics that are closer to their day-to-day tasks.
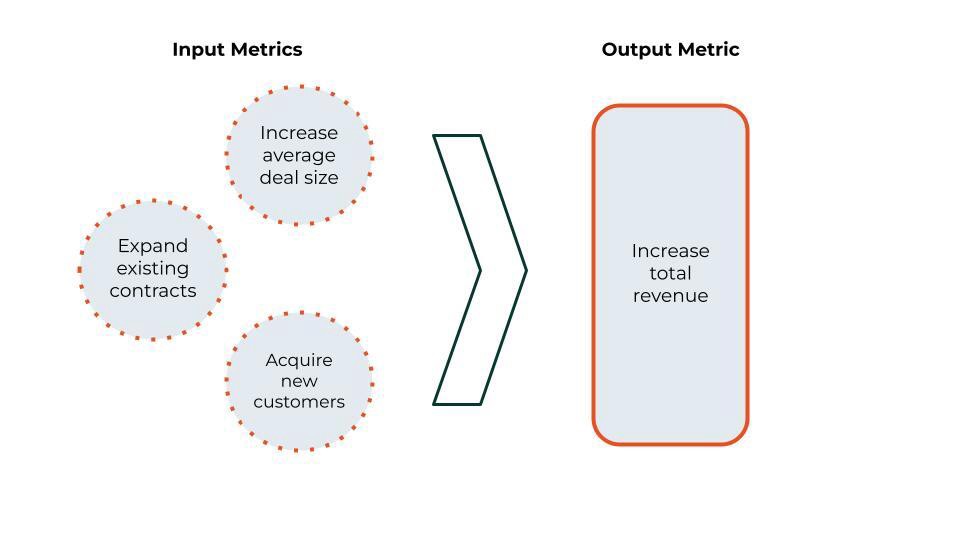
For example, an e-commerce business most likely has revenue as an output metric. The company has a goal of increasing revenue. This metric can be influenced by increasing sales, increasing price, acquiring new customers, and a myriad of other actions.
Because output metrics can be influenced by many activities, it is useful to set goals relative to an output metric, but to manage relative to the input metrics that influence this output metric.
Input metrics
As hinted in the above definition of output metrics, input metrics are metrics that influence output metrics, but are controllable by teams/individuals. In the e-commerce example, number of new customers, average sale value, and number of sales would all potentially be input metrics.
I say “potentially” because it is critical that you make sure an input metric actually influences the output metric. Validating an input metric’s importance is a separate topic, but methods from simple correlation to complex causal impact models can all do the trick.
Input metrics are only valuable if they actually move an important output metric. This way, when output metrics aren’t up to par, the cause can be traced back to a relevant input metric.
Framework
Using these two types of metrics, we can set up a framework to increase the efficiency of decision making.
First, identify the important output metrics for a business. Let’s say we are only concerned with revenue and cost. Now we can break each one down into the relevant input metrics. There are many ways to do this breakdown, but it is important to make sure that these metrics influence the output metric and are controllable by a team.
For revenue, we may have total opportunities (which marketing is responsible for), deal volume (which sales is responsible for), deal size (which the deal strategy team is responsible for), and many others. Each team may then break down their own metric into sub-metrics to make responsibility more granular.
This framework, with diligence, distills a metric set to relevant metrics with relevant owners. Understanding the chain of metrics helps clarify the actionable decisions a business can make when a goal falls short.
Reporting vs. analysis metrics
Input and output metrics are generally familiar and the framework that they create is pretty straightforward. Differentiating between reporting and analysis metrics is less obvious and can be equally beneficial. While input and output metrics differ in their controllability, reporting and analysis metrics differ with respect to decision timing and frequency.
Reporting metrics
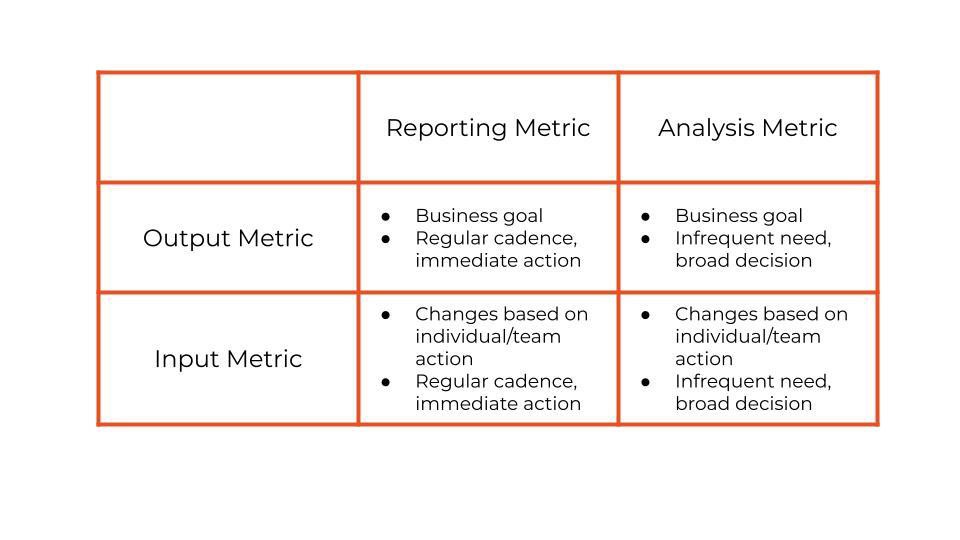
Reporting metrics are primarily diagnostic. They are set up to be checked daily or weekly and changes can be actioned quickly. They can be simple counts, ratios, and sums, and are generally indicative of a problem if gone awry. These usually come up in weekly business reviews and daily status reports.
In addition, reporting metrics can be either input or output metrics. For example, most companies have revenue as a reporting metric. It is monitored very closely and when there are changes to the metric, action is taken immediately to discover why and decisions are made to fix whatever problem caused the change.
Analysis metrics
Analysis metrics are used for less frequent and more broad decisions. Certain decisions aren’t made in a repeated or immediate fashion and the metrics for these decisions are generally not trackable in a weekly format. These metrics generally take longer time windows to compute or require more data.
For example, someone may be curious whether the current sales team structure is problematic, in which case, someone might develop a metric around the volatility of sales across sales teams. This metric should not be reviewed consistently because it won’t change frequently, but it’s a useful analysis metric to decide whether a restructure is needed.
Framework
The difference between these metric types is a little more subjective than input and output metrics, but the distinction can help identify which metrics to review and when to to review them.
First, it is important to identify which metrics are reporting metrics. This involves identifying which metrics are immediately actionable and would be of concern if they changed suddenly. This set of metrics should have known actions or a playbook attached. It’s nearly pointless to monitor a metric if you don’t know what you are going to do if it changes.
Reporting metrics should be reviewed in a daily or weekly forum with tasks assigned accordingly.
Analysis metrics are also important, but less immediate. Create these metrics when a problem needs to be assessed or a strategic decision needs to be made. They can then be reviewed once enough data is collected or regularly but less frequently than reporting metrics, like in a quarterly meeting.
Reviewing analysis metrics on a weekly basis can be unproductive because no decision is generally tied to them.
Creating these distinctions allows metrics to be used intentionally and makes sure that the correct metric is being used to make the correct decisions.
Summary
Input, output, reporting, and analysis metrics are simply ways to have a shared vocabulary around metric types, and using these definitions can better organize how data is used to make decisions. The general takeaway should be to create metrics that are relevant to the intended output of your business and assignable to people or teams that can make an impact. Additionally, make sure when reviewing metrics that they are actionable on the cadence that you are reviewing because not all metrics are relevant all the time and some metrics aren’t ever relevant.