Unlocking metric actionability with dimensions
At Falkon, we think about metrics a lot. As such, I wanted to start a blog series about the different elements that go into building and using metrics that empower organizations to make the right decisions at the right time. Over the course of this series, I’ll review various challenges based on past experience and conversations with practitioners and customers.
For this first post, I’ll cover an all-too-common occurrence where an organization has found the behavior, activity, or outcomes that they want to track, but struggle to represent them with enough fidelity to actually support quality decision making due to a lack of dimensional richness.
What is a Dimension?
Before jumping in, let’s level set on what I’m referring to as a dimension. Quite simply, a dimension is a way to filter or slice and dice a metric. For instance, a simple metric might be total revenue. A dimension I might add to this metric could be Region, so now I can represent an aggregate revenue, or revenue for any individual region, such as Revenue: USA or Revenue: Canada.
As a marginally capable home chef, I like to think of dimensions as the spices that bring out the unique flavor in an otherwise bland measure. Each new dimension we add layers a new perspective into our experience with the metric. And, by combining the right blend of dimensions, we find that their interactions yield an even more complete understanding of the underlying dynamics of the metric than was possible with any one of them separately.
Why do dimensions matter?
Let’s say I’m an analyst for the sales organization of a B2B company which tracks weekly booked revenue as a key metric. Each Tuesday during our weekly business review, we talk about what’s changed and discuss any actions to take as a result of what we see. This week, in preparing for the meeting, I notice revenue has dropped considerably below its typical range over the past several months. This will undoubtedly be a topic of much debate, so now I need to attempt to understand what is going on.
If I don’t have any actionable dimensions prepared, this means I’ll have to spend several hours analyzing past performance, exploring the available data, and building out queries and dashboards to hopefully come up with an explanation for what happened. In the event I don’t have any time to dedicate to this, we’ll have to resort to intuition and past personal experiences, which will lead to more time debating and less time acting on a solution.
However, if I have developed rich, actionable dimensions which map to segments that our team can either control or investigate more deeply, such as account ID, assigned sales rep, customer segment, and SKU, the conversation changes dramatically. Once these are in place, I should be able to move quickly from broad observation to a pinpoint targeting of the key change drivers. For example, the flow in this example might look like:
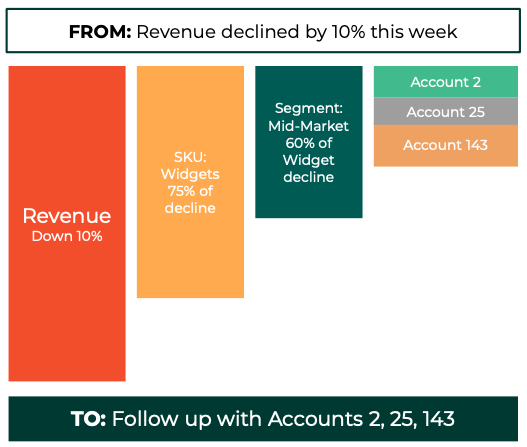
- Revenue is down by 10% this week. This is much lower than we would expect.
- Revenue for SKU: Widgets drove 75% of the decline
- 60% of this drop in Revenue for SKU: Widgets was attributable to Mid-market customers
- Accounts 2, 25, and 143 accounted for 40% of this drop. Let’s reach out to their respective account managers to see if they have deeper insight.
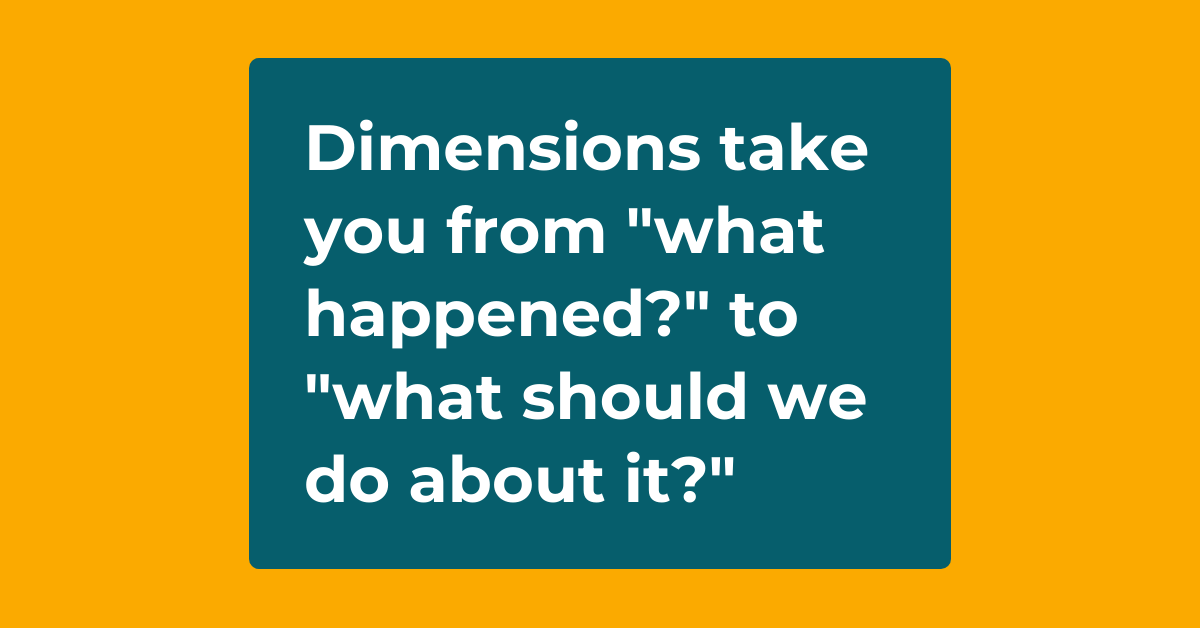
With just these four dimensions available, we can shift the conversation from “what is going on?” to “what should we do about it?”
What happens when there are too many dimensions?
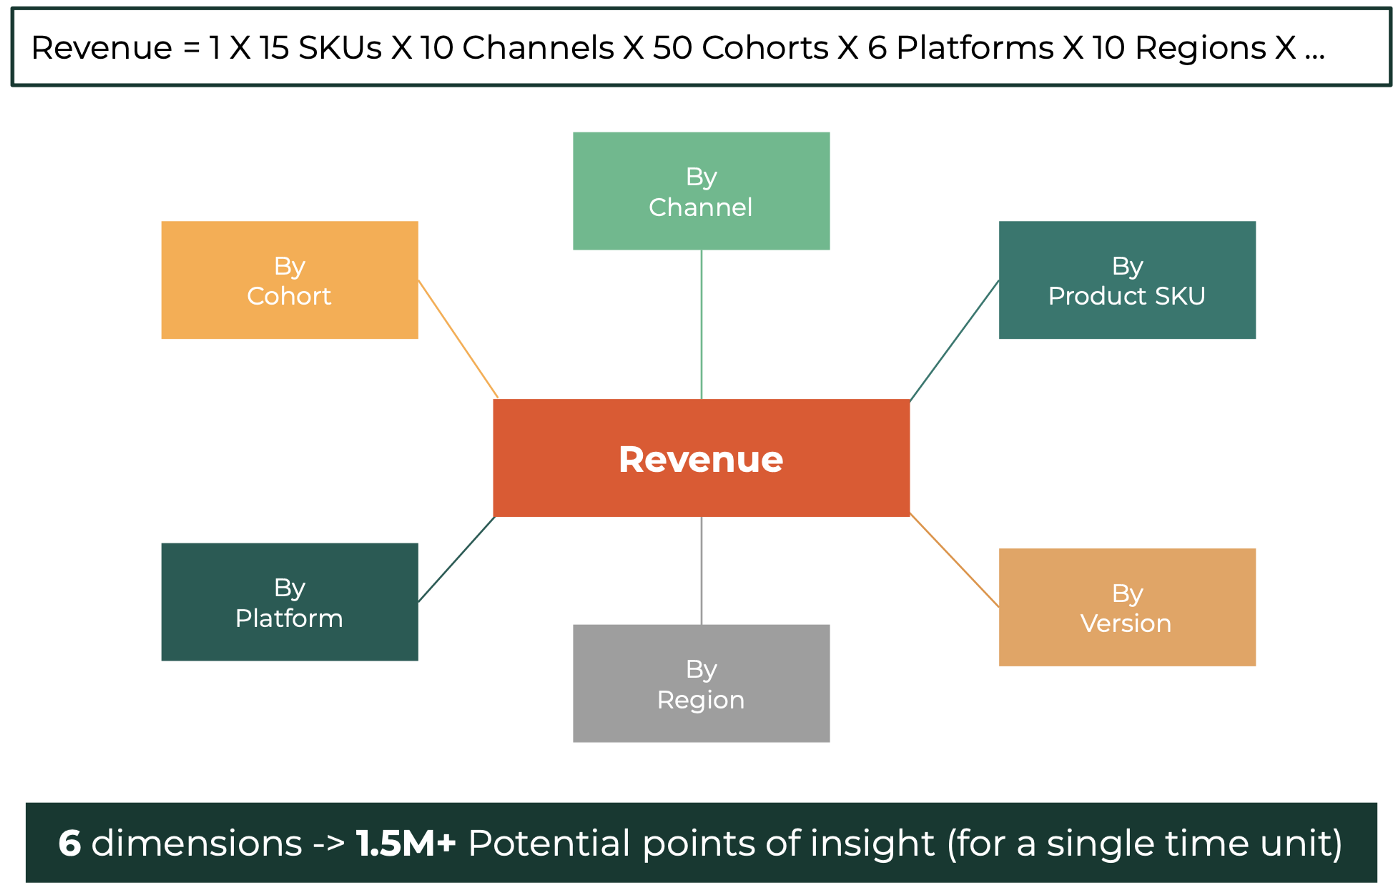
Now, in practice, most organizations and teams recognize that adding even a handful of dimensional axes along which to explore the metric gives much greater control over understanding and driving the future development of the metric. Unfortunately, we’re still presented with a problem in that with every subsequent dimension we add, the complexity of representing and tracking all of the various permutations of dimensions, what we call segments, becomes exponentially more challenging.
As a result, we typically see that most teams conduct one-off deep dives perhaps every quarter or so to understand the two or three most important dimensions and selectively represent those. Beyond this, separate dedicated visuals typically need to be created for anything exceeding three dimensions (and arguably even just two, as time is typically the default third dimension), since representation of any number beyond three dimensions is exceedingly difficult to do in most BI platforms, from advanced dashboards to the simple spreadsheet. This increases the chance for drift in definitions, adds more elements that need to be considered in decision making, and can generally inject noise to the decision-making process.
Thus, we end up in a scenario where teams may have an idea of the extent of dimensional richness that is possible to track, but are forced to narrow their focus, limiting what is available to inform real-time decision making in a weekly business review context. Alternatively, teams have to be willing to wait the additional time needed to get to a deeper level of insight — which has the added cost of randomizing analytics and science teams from whatever they were actively working to answer these questions.
Thankfully, modern metrics platforms like Falkon are making these tradeoffs a problem of the past by intelligently searching across all dimensions to surface the most important dimensional change drivers. This enables teams to harness the dimensional richness of their metrics in real-time, leading to faster and more impactful decision making.
Improving Dimensional Richness
While discovering high-quality dimensions is a mix of art and science, here are some shared traits we’ve seen in teams that consistently uncover and track rich, actionable dimensions in their metrics:
- Focus on developing deep subject matter expertise among the analytics and science teams such that they command a strong intuitive understanding of the problems their team is solving. This allows data teams to better frame their understanding of available data, possible dimensions, and elegant questions to ask of it.
- Co-locate data teams alongside stakeholders who are living and breathing the KPIs. Scientists and analysts should embed directly within these teams, be them product and engineering, operations, supply chain, sales and marketing, or anything else, rather than being acting as a loaned-in resource.
- Invest in robust platforms and processes for centralizing metric definitions and documenting available data, such that data teams can easily access the breadth of collected information in determining how to construct new dimensions.
- If you don’t have tooling that allows for efficient dimensional exploration, dedicate analytics time to regularly refreshing your deeper analyses of the dimensions that matter and store those in a centralized location for easy access and commentary from others.
We call the combination of richly defined metrics, rigorous centralization and governance, and continuous visibility metrics operationalization. In the next article, I’ll turn to an equally challenging component of metric development — effective representation of distributional data.
Want more articles like this? Follow Falkon on LinkedIn >